NLSY97 demo
Objective
This tutorial walks you through the basic steps of selecting multiple search criteria to construct a data set using the NLSY97 cohort. It also demonstrates how to create a frequency distribution from your selected variables and how to apply a universe restrictor using Investigator's equation editor to further customize your data set.
Example: Downloading NLSY97 education variables
Preview of steps
- Step 1: Add first search criterion
- Step 2: Add second search criterion
- Step 3: Display search results
- Step 4: Select variables of interest
- Step 5: Review selected variables
- Step 6: Create a frequency distribution
- Step 7: Apply universe restrictors
- Step 8: Accessing your extract
Additional information shows the downloaded files created by Investigator and verifies the application of the universe restrictor in the data set.
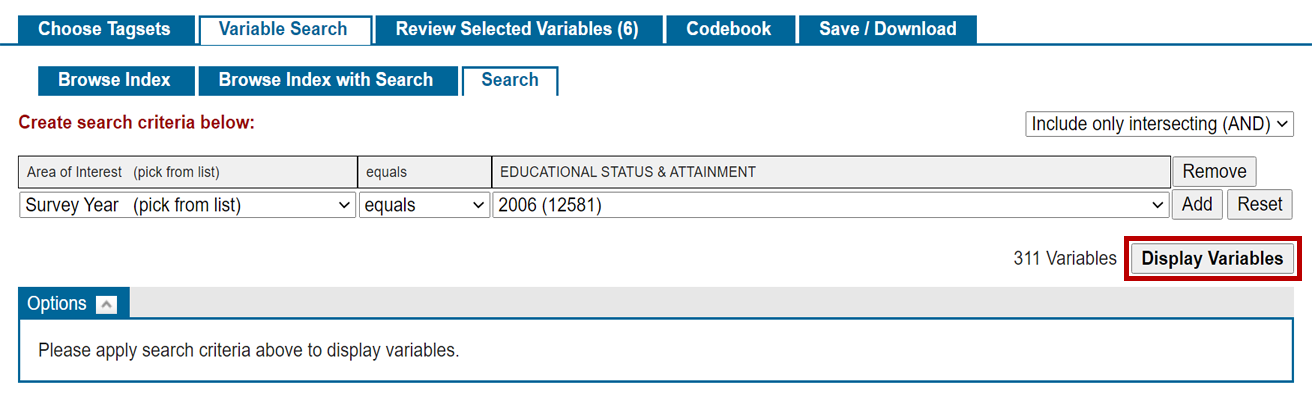
Step 1: Add first search criterion
Begin by navigating to the Search Sub-Tab under the Variable Search Tab to access the criterion builder.
- Label 1 in the upper left corner shows that the NLSY97 cohort has been selected for this demo.
- Labels 2-4 show the three drop-down menus that make up the menu bar portion of the criterion builder.
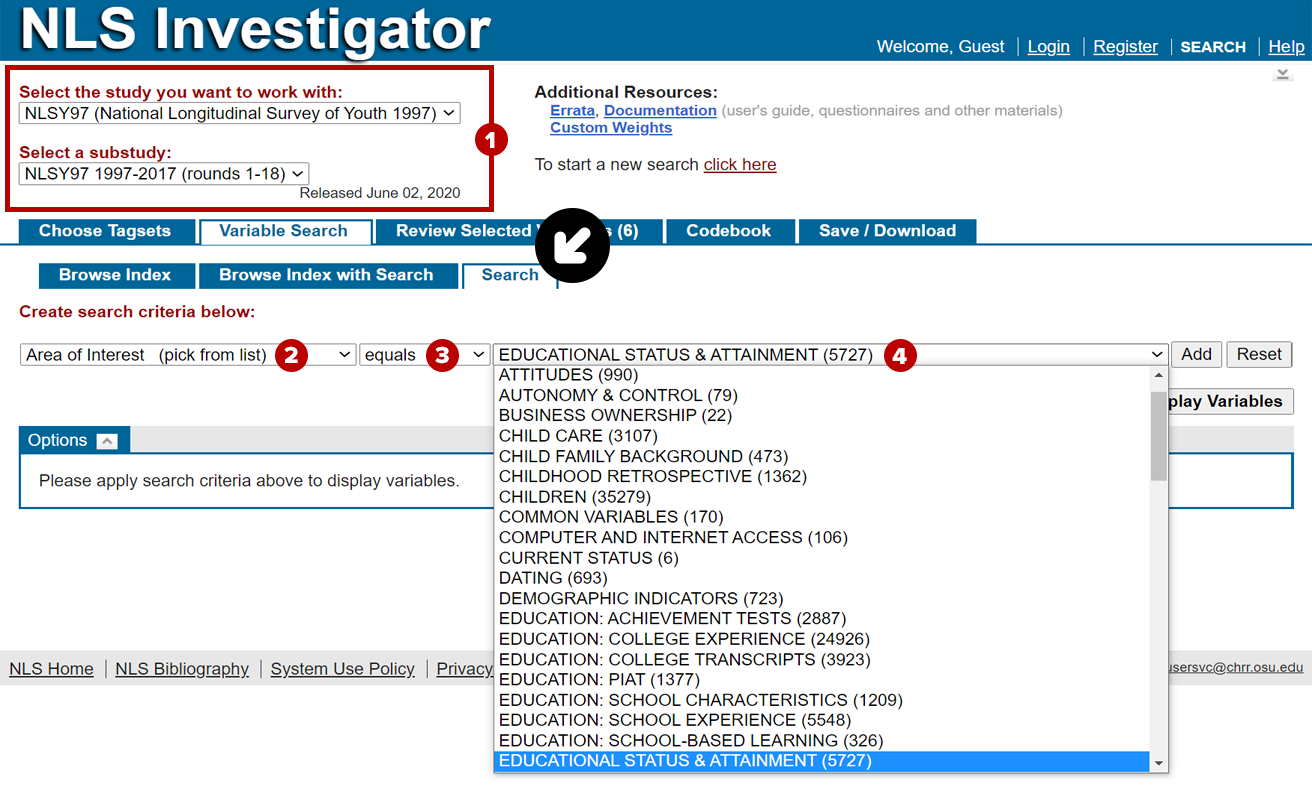
For this demo, select the following:
- In the first drop-down menu from the left, choose: Area of Interest.
- In the second drop-down menu from the left, keep the default setting: equals.
- In the third drop-down menu from the left, choose: Educational Status & Attainment.
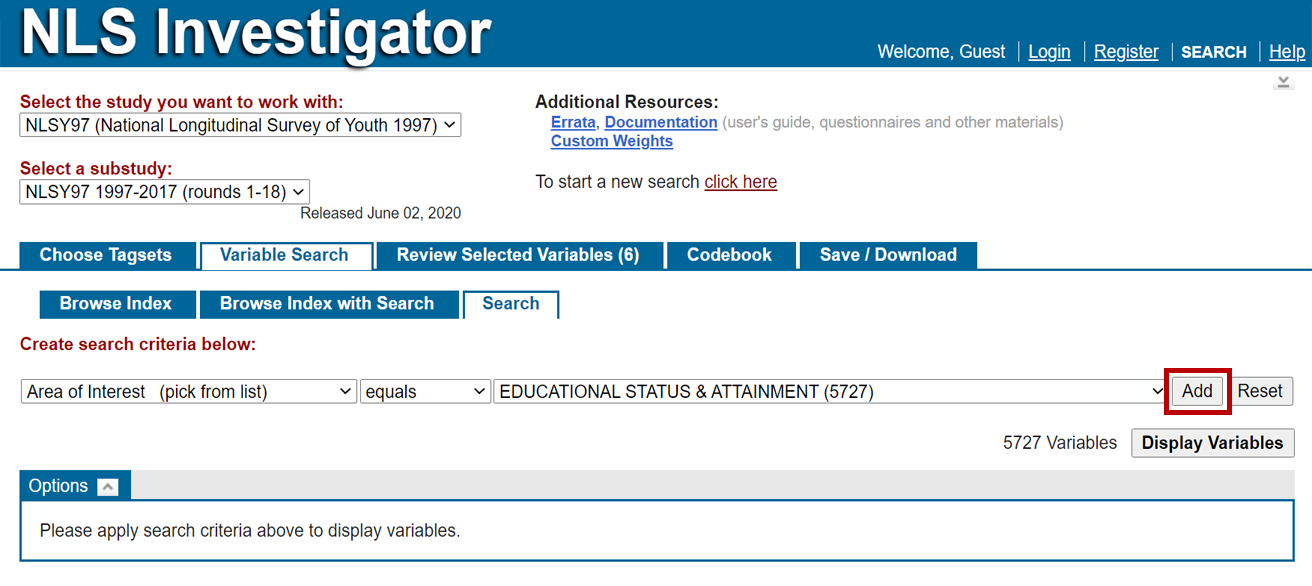
- Finally, click the Add button to include your choices in the search criteria.
Step 2: Add second search criterion
Once the Add button has been clicked (Step 1), the criterion builder will add a new row of drop-down menus below the first set in order to add a second criterion. Select the following:
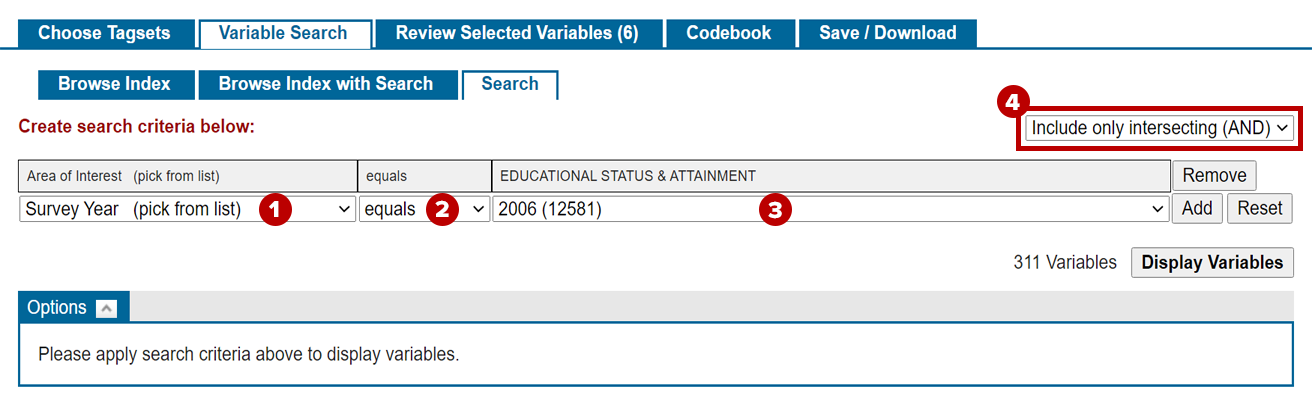
- In the first drop-down menu from the left, choose: Survey Year.
- In the second drop-down menu from the left, keep the default setting: equals.
- In the third drop-down menu from the left, choose: 2006.
- With the two search criteria selected, you can choose how the search criteria interact with each other by choosing AND or OR.
- Choose one of these options from the drop-down menu above your selected search criteria on the right side of the page.
- For this example, make sure AND (the default) is selected. Using AND for our search criteria of Educational Status & Attainment with the Survey Year reduces our results to 311 variables.
Note: Clicking the Add button for the second criterion is optional.
Step 3: Display search results
Click the Display Variables button to view a list of variables with their RNUM, question name, variable title, and survey year. Additional variable display options are listed on the Customize Your Search page.
By default, the list includes only the Primary Variables as indicated by the drop-down menu above the variable list, thus 177 of 311 total variables are listed. Choosing the Primary and Secondary Variables preference level in this drop-down menu will return 194 of 311 variables, and choosing the All Variables preference level will result in showing all 311 variables.
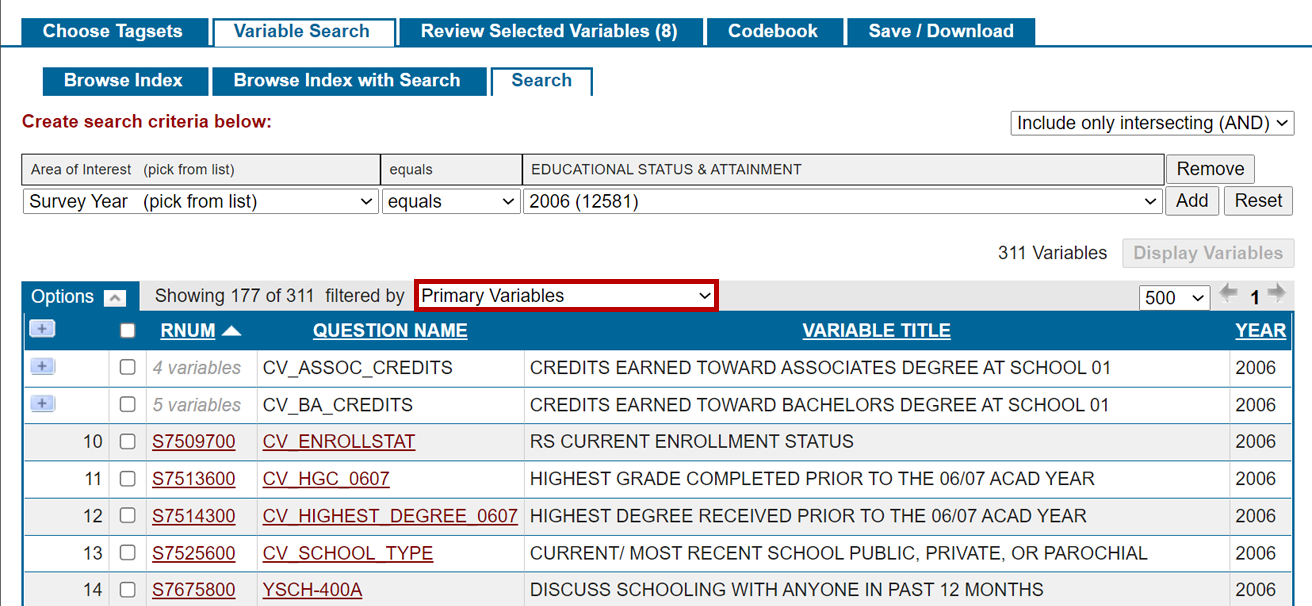
Step 4: Select / tag variables of interest
Next, we will pick two created variables (CV) showing the Highest Grade Completed and Highest Degree Received.
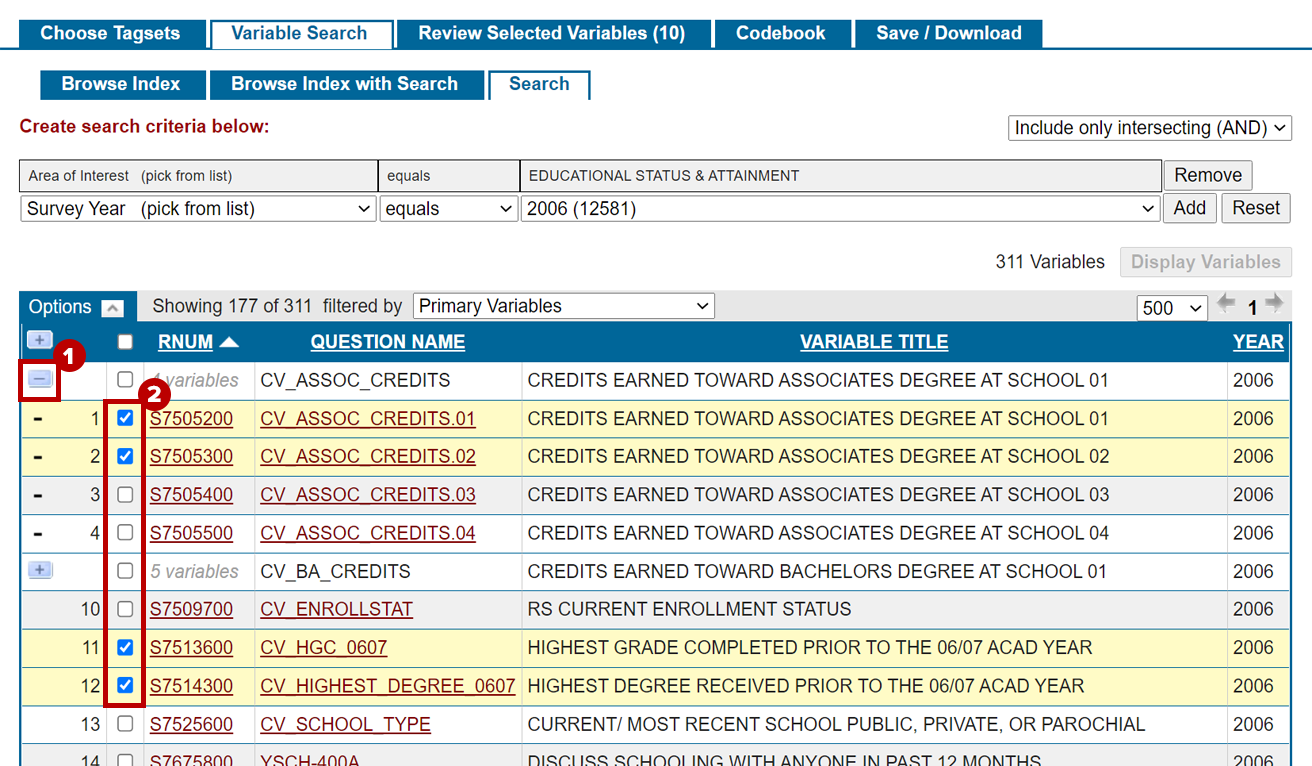
- Expand CV_ASSOC_CREDITS by clicking on the + in the first column of that row.
- Select: S7505200, S7505300, S7513600, and S7514300 by clicking the checkboxes to the left of the RNUM column.
Note: We recommend that you review the codebook page for each chosen variable to verify that it presents the desired data.
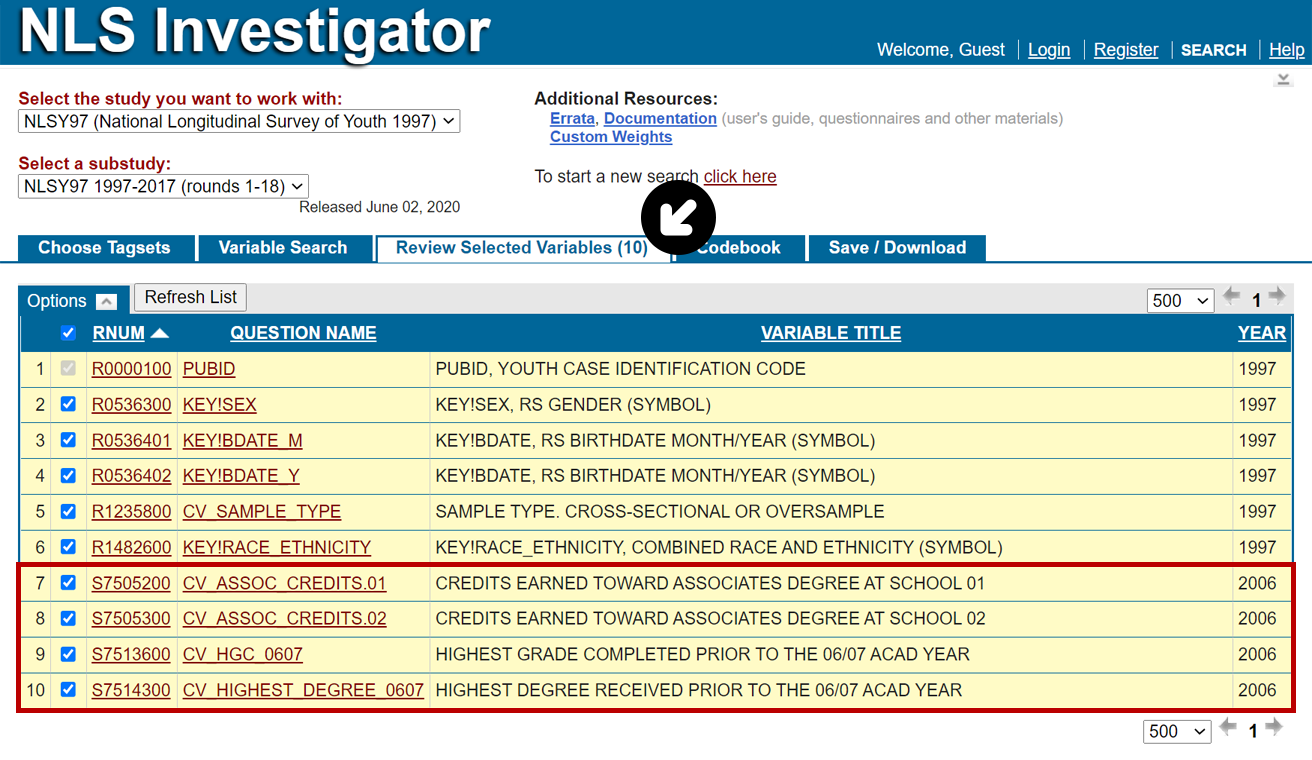
Step 5: Review selected variables
View your tagset in the Review Selected Variables Tab to make sure you have tagged all of your variables of interest. For this example, your list should include ten variables: six preselected ID and demographic variables and the four education variables tagged in Step 4.
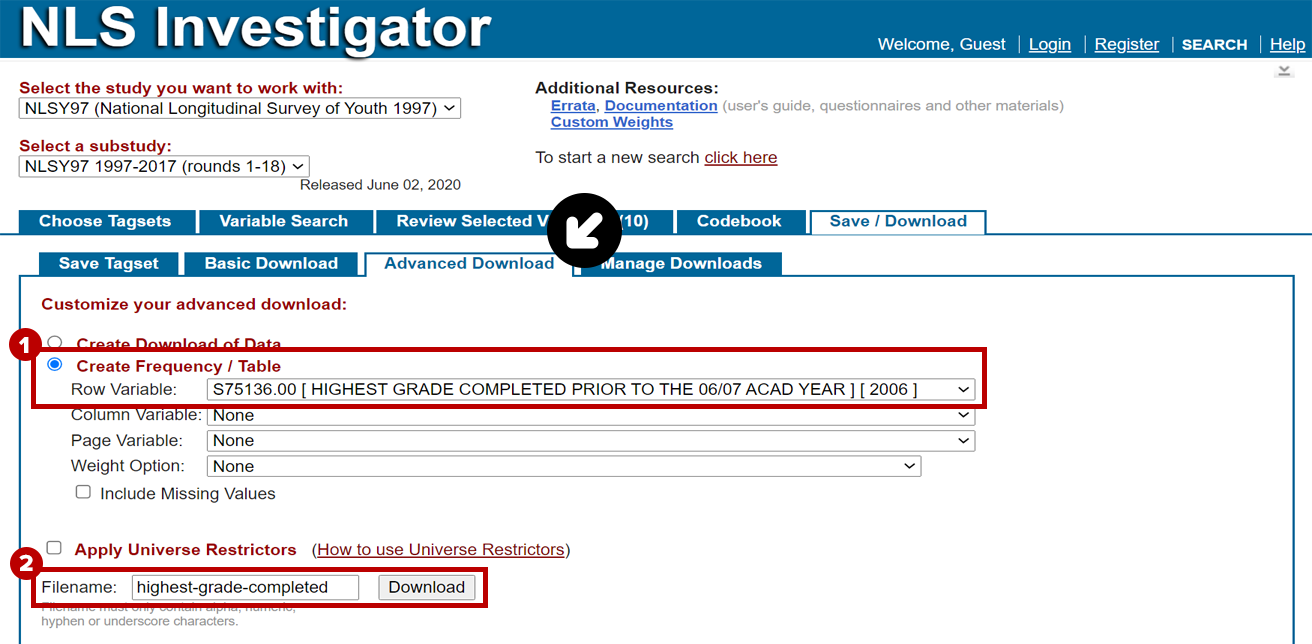
Step 6: Create a frequency distribution
Using NLSY97 respondents' Highest Grade Completed Prior to 2006/2007 Academic Year, we will generate a frequency distribution. The Create Frequency / Table function is located on the Advanced Download Sub-Tab under the Save / Download Tab.
- Select the Create Frequency / Table radio button to set the parameters:
- Click the drop-down menu labeled Row Variable.
- Choose S75136.00 from the variable list.
- Give your frequency distribution a name in the Filename text box and click the Download button.
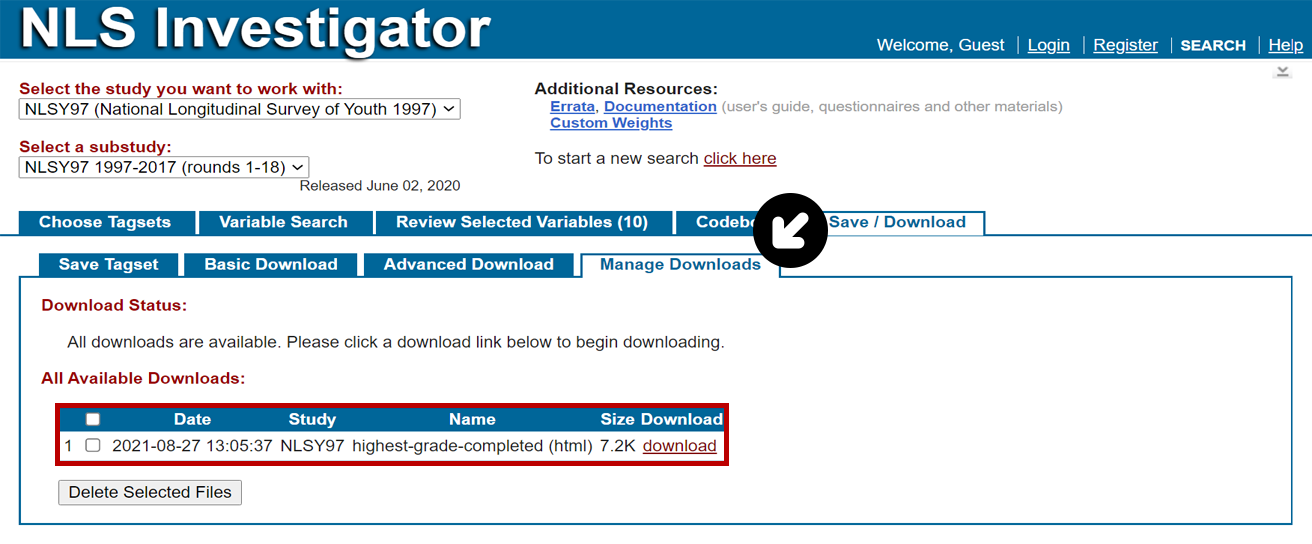
The Manage Downloads Sub-Tab will open to show the status of the Create Frequency / Table function. Once completed, the resulting frequency distribution will be listed under All Available Downloads. Note: The Create Frequency / Table function produces an HTML file that will open in a new browser window when the download link is clicked.
The SAS System
| CV_HGC_0607 2006 | ||||
|---|---|---|---|---|
| S7513600 | Frequency | Percent | Cumulative Frequency |
Cumulative Percent |
| Frequency Missing = 1504 | ||||
| 5 | 2 | 0.03 | 2 | 0.03 |
| 6 | 19 | 0.25 | 21 | 0.28 |
| 7 | 41 | 0.55 | 62 | 0.83 |
| 8 | 260 | 3.48 | 322 | 4.30 |
| 9 | 395 | 5.28 | 717 | 9.59 |
| 10 | 492 | 6.58 | 1209 | 16.16 |
| 11 | 586 | 7.83 | 1795 | 24.00 |
| 12 | 5680 | 75.94 | 7475 | 99.93 |
| 95 | 5 | 0.07 | 7480 | 100.00 |
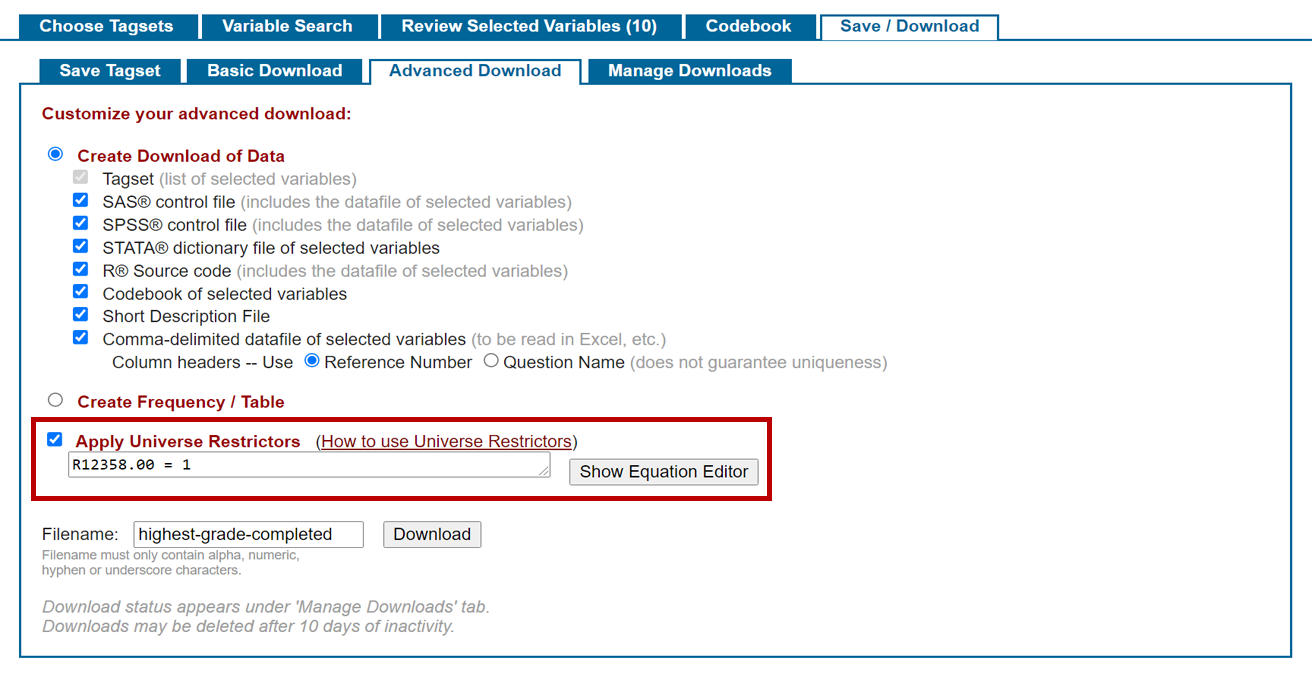
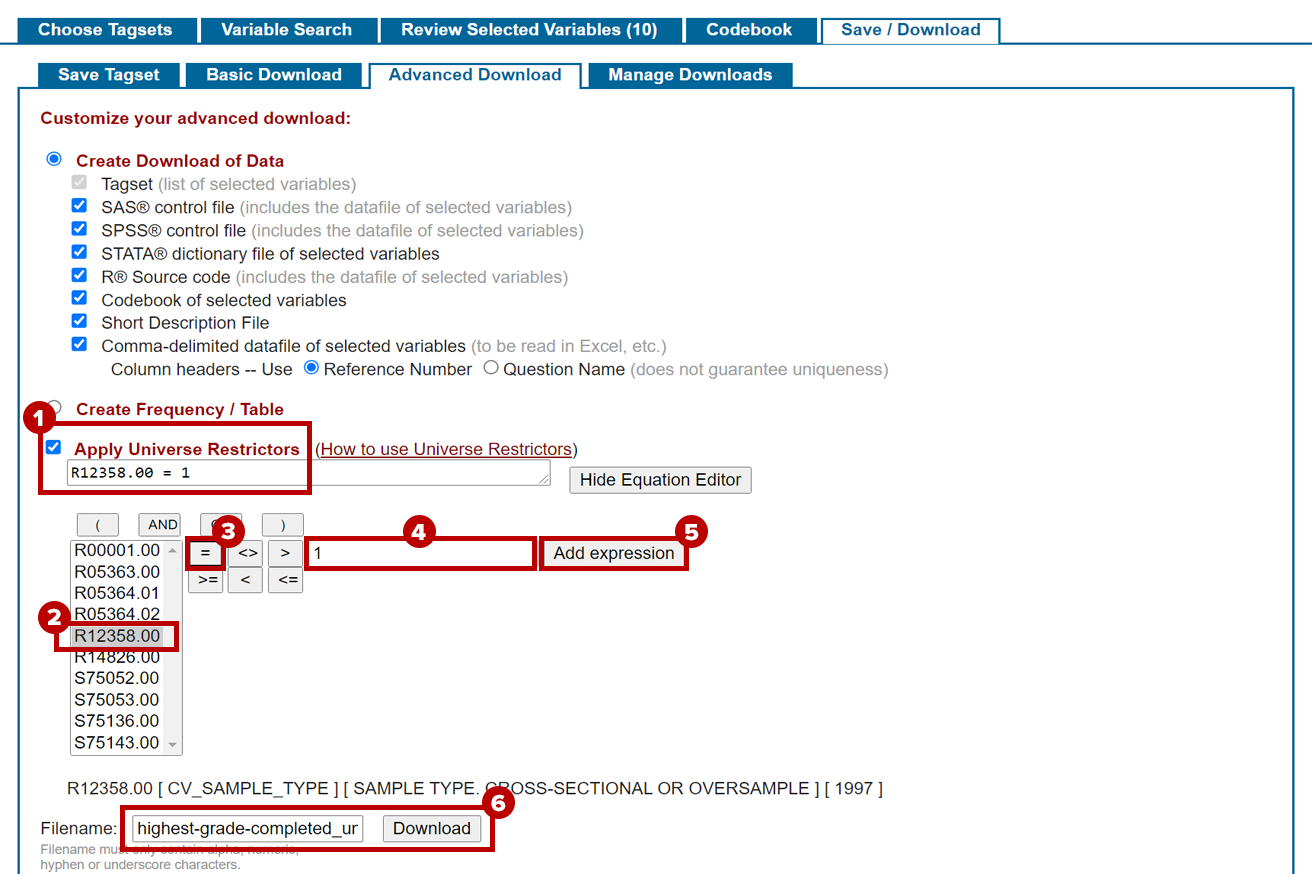
Step 7: Apply universe restrictors
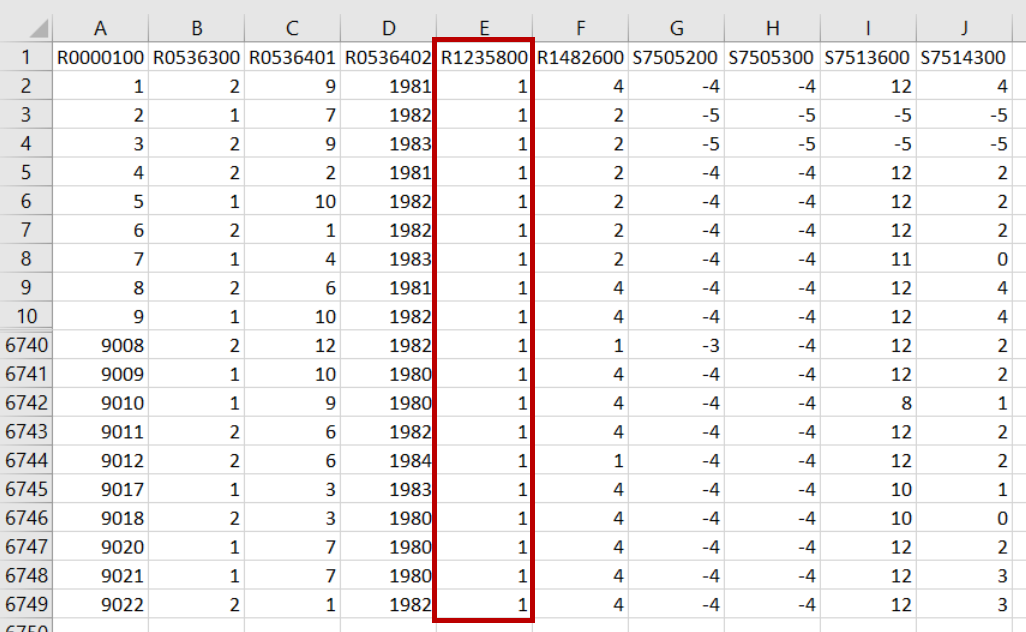
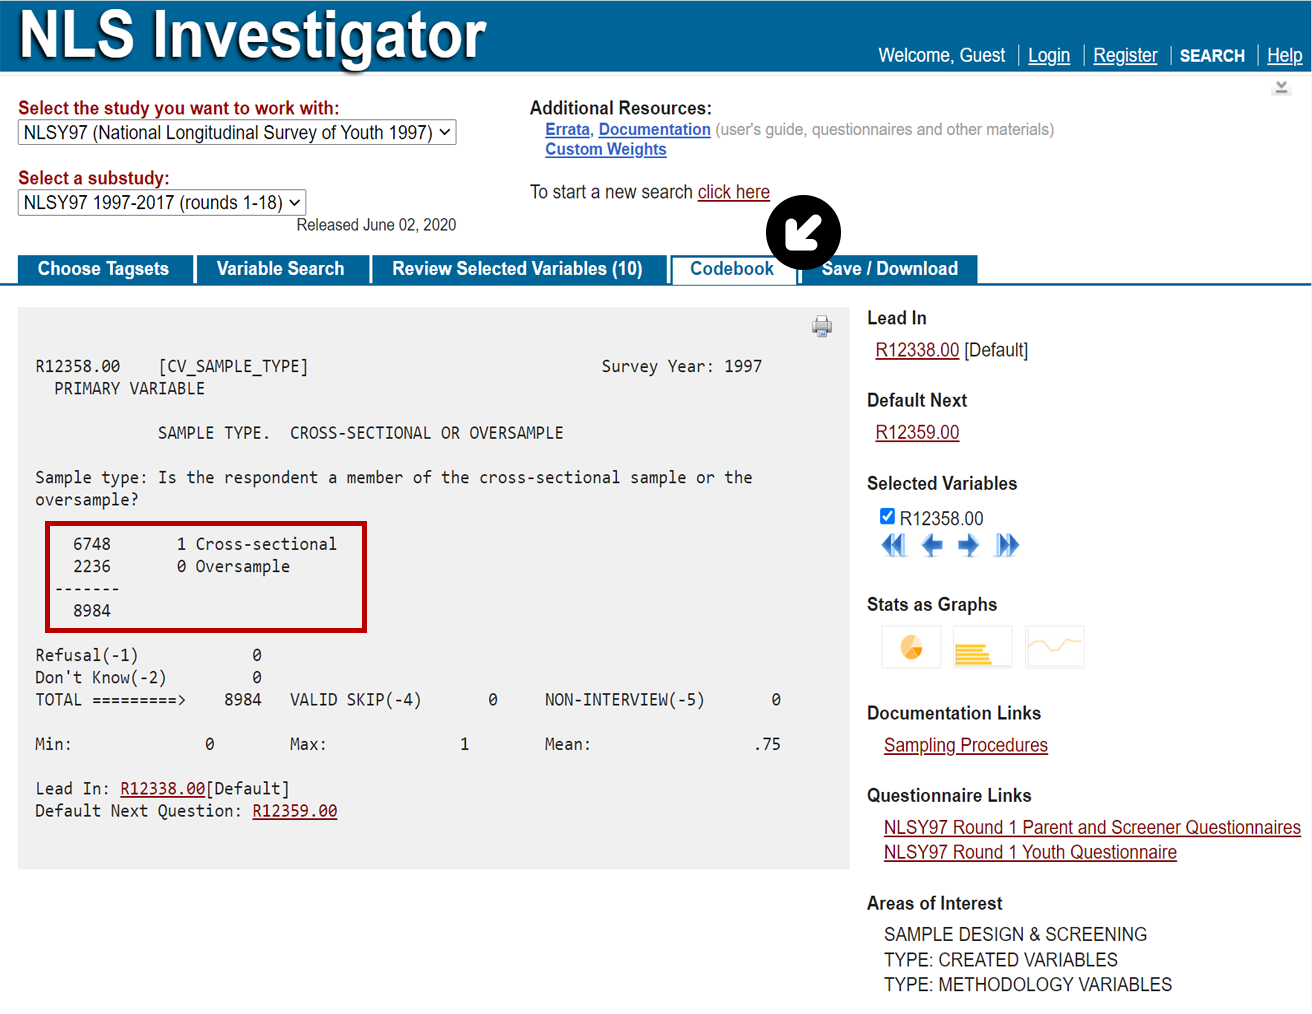
For this portion of the demo, we will apply a universe restrictor using the variable R12358.00 to select respondents in the cross-sectional sample only. When reviewing the variable in the Codebook Tab, respondents who are members of the cross-sectional sample are designated by a 1 with 6,748 observations, while respondents from the oversample are designated by a 0 with 2,236 observations for a total sample of 8,984 observations.
The Apply Universe Restrictors function is located in the Advanced Download Sub-Tab below the Create Frequency / Table function. To set your universe restrictor:
- Click the checkbox to the left of Apply Universe Restrictors label.
- Type: R12358.00 = 1 in the text box.
Additionally, you may click the Show Equation Editor button to the right of the text box to build your equation:
- Click the checkbox to the left of Apply Universe Restrictors label.
- Select your variable in the list.
- Choose an operator:
- equals =
- not equal <>
- greater than >
- greater than or equal to >=
- less than <
- less than or equal to <=
- Enter a value.
- Click the Add Expression button to load the equation in the text box.
- Give your extract a name in the Filename text box and click the Download button.
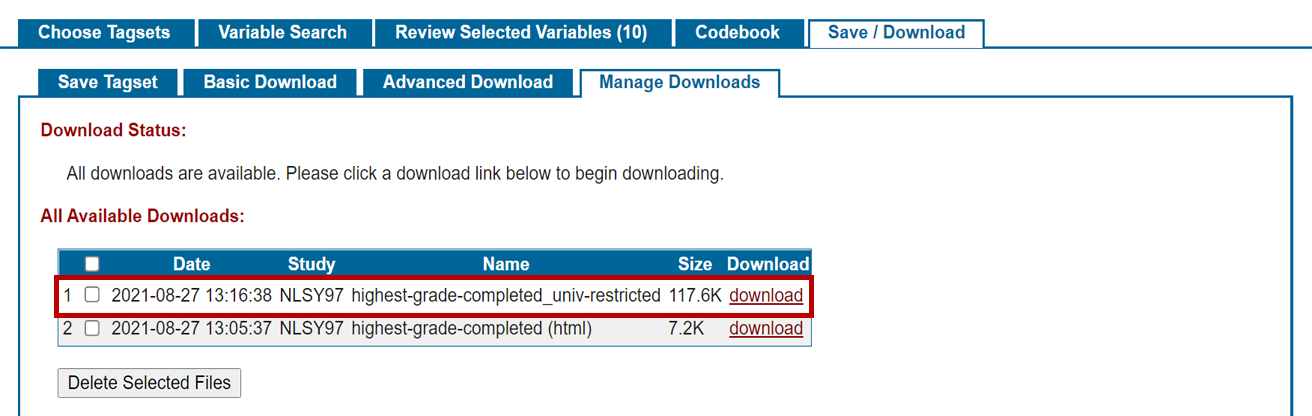
Step 8: Accessing your extract
The Manage Downloads Sub-Tab will open to show the status of your extract. Once completed, the resulting data set will be listed under All Available Downloads and will save a .zip file to your computer when the download link is clicked.
Additional information
The .zip file will contain several files based on the selections that you made in the Advanced Download Sub-Tab. An explanation of the of the .zip contents can be found on the Create Download of Data page.
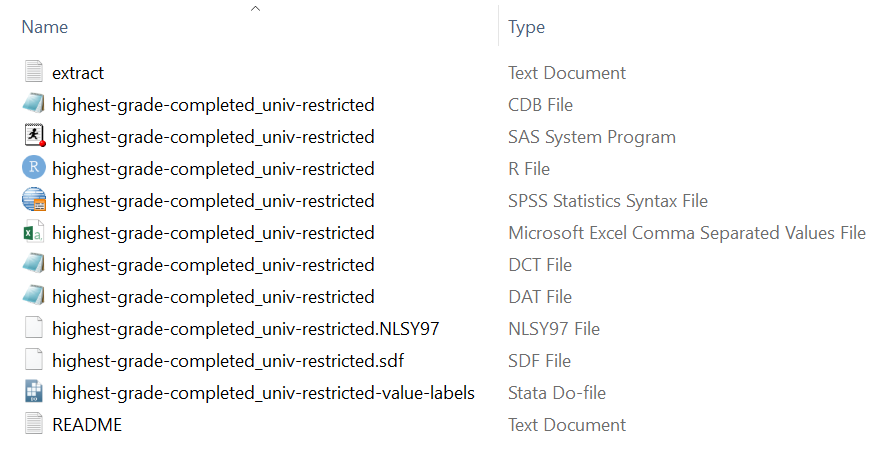
In the downloaded .zip, we can open the Excel file to see the results of the universe restrictor. In the file, our data set contains 6,748 observations of the cross-sectional sample type (column E) out of the total 8,984 observations from the full NLSY97 sample.